Hi, I'm AJB.
I build microsites, design maps, and experiment with modern data visualization techniques to examine complex issues.
I'm also an established photographer working across editorial and commercial markets.
Foresight Works0
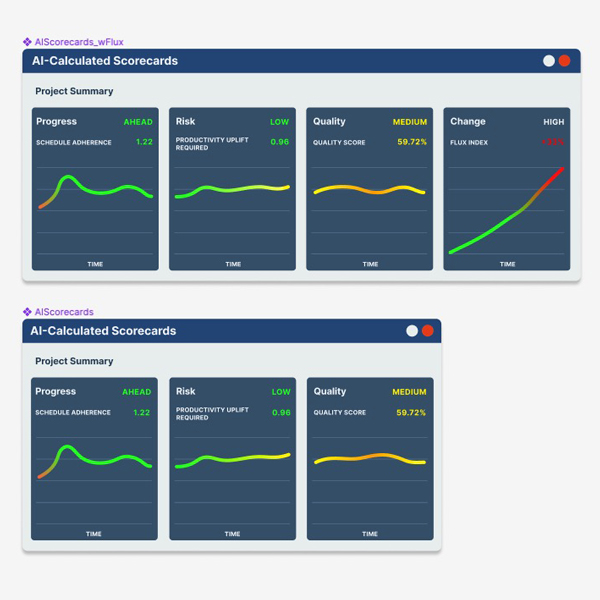
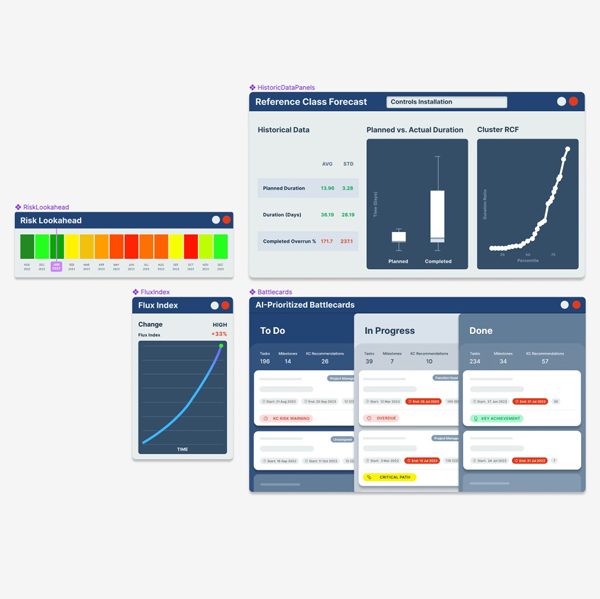
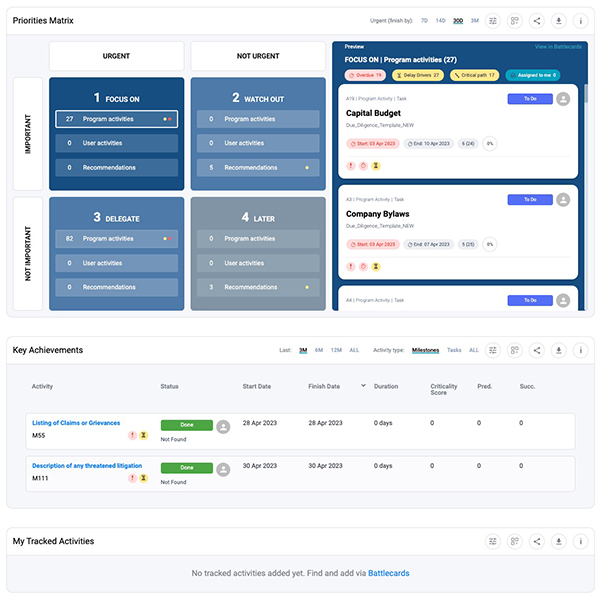
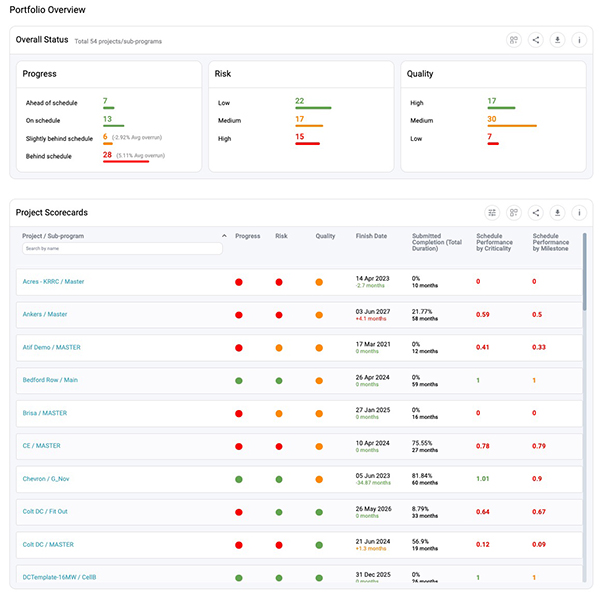
As a consultant design director for this construction-sector startup I designed a suite of dashboards to draw users' attention to key moments in a project's schedule.
Figma, AfterEffects, React Native
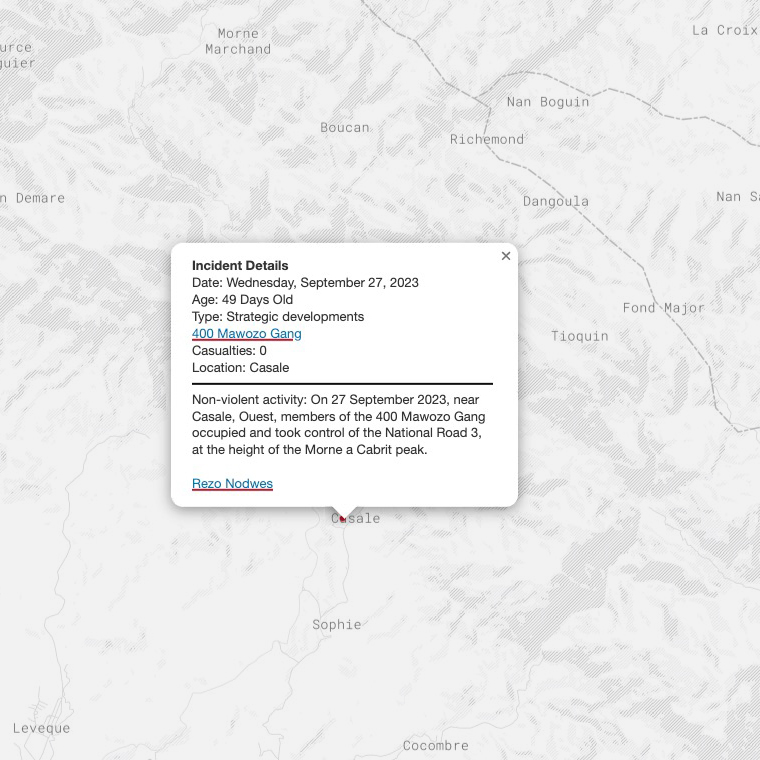
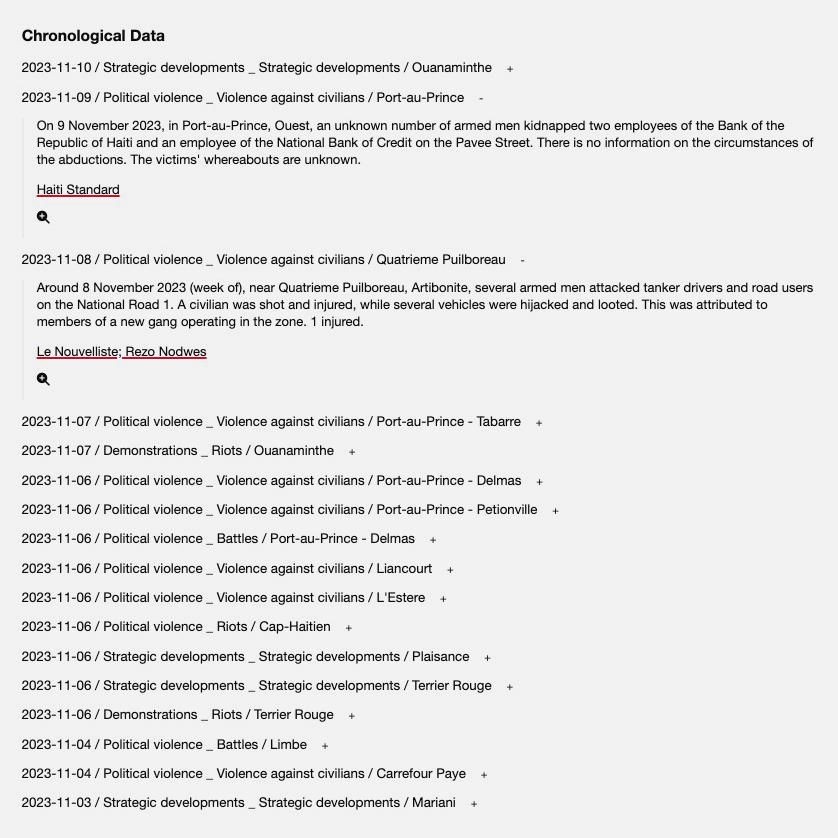
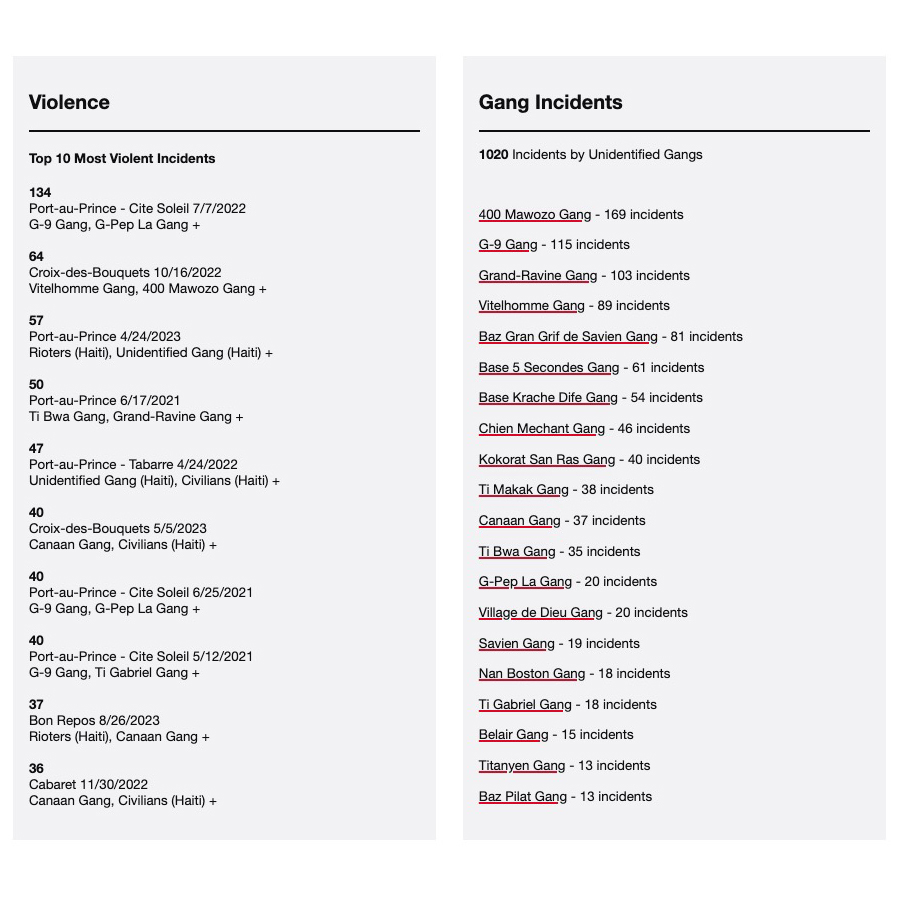
ACLED Haiti
As a longtime visitor to Haiti I am interested in the evolving political situation. Using data from the Armed Conflict Location & Event Data Project API, I created a simple map and dashboard to plot events. Though this project is focused on Gang warfare in Haiti, this project is easily ported to a variety of other situations.
Svelte, ACLED API, Leaflet, Mapbox, D3
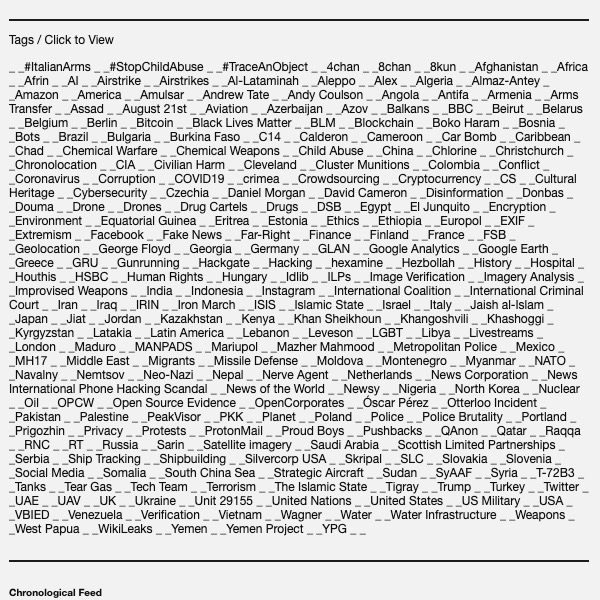
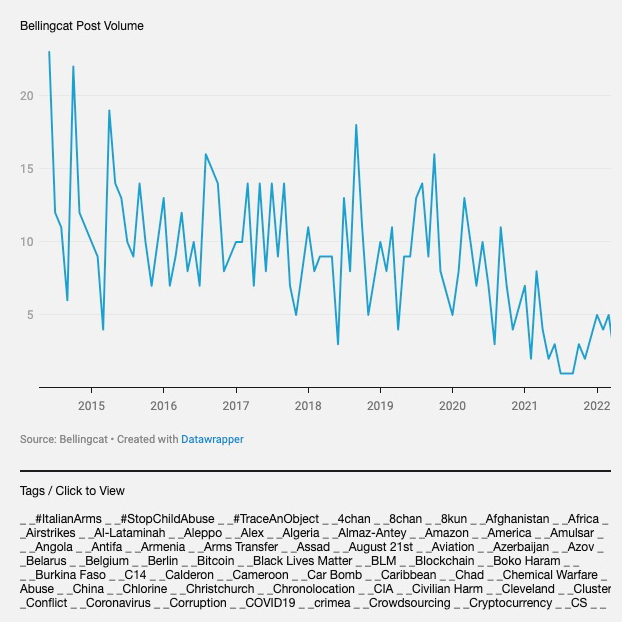
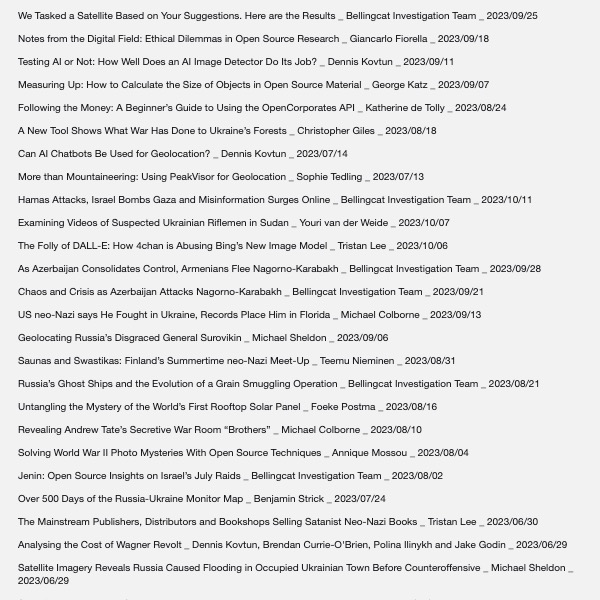
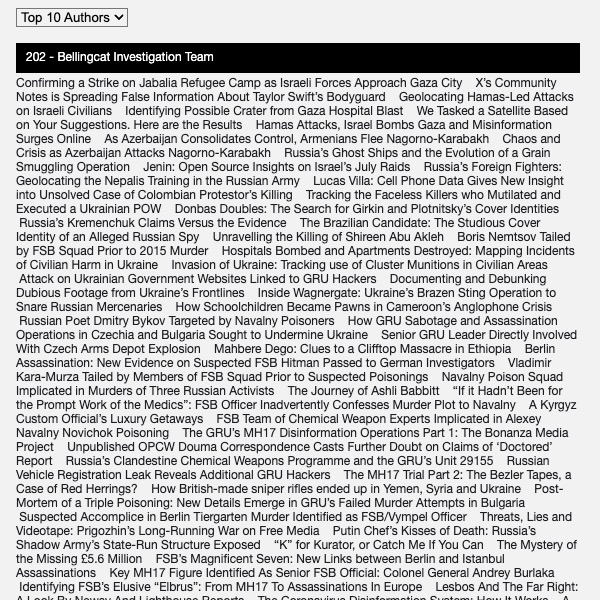
To better understand the scope and frequency of contributions to the OSINT organization Bellingcat, I built a dynamic aggregating tool. This focused display is a much easier way to see the history of Bellingcat from a glance at its contributors and themes.
Svelte, Python, D3, Datawrapper, Vercel, Cron
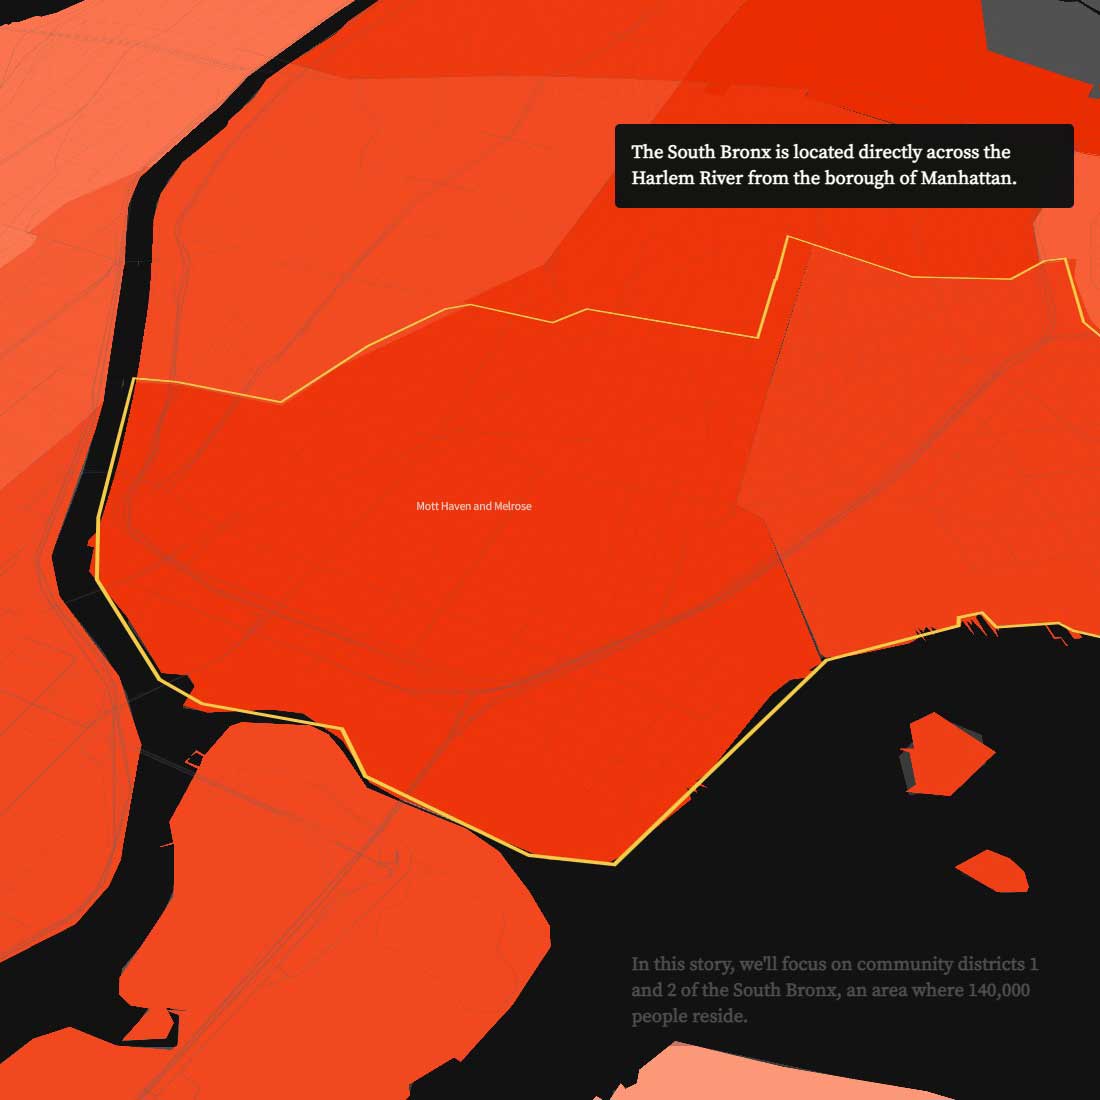
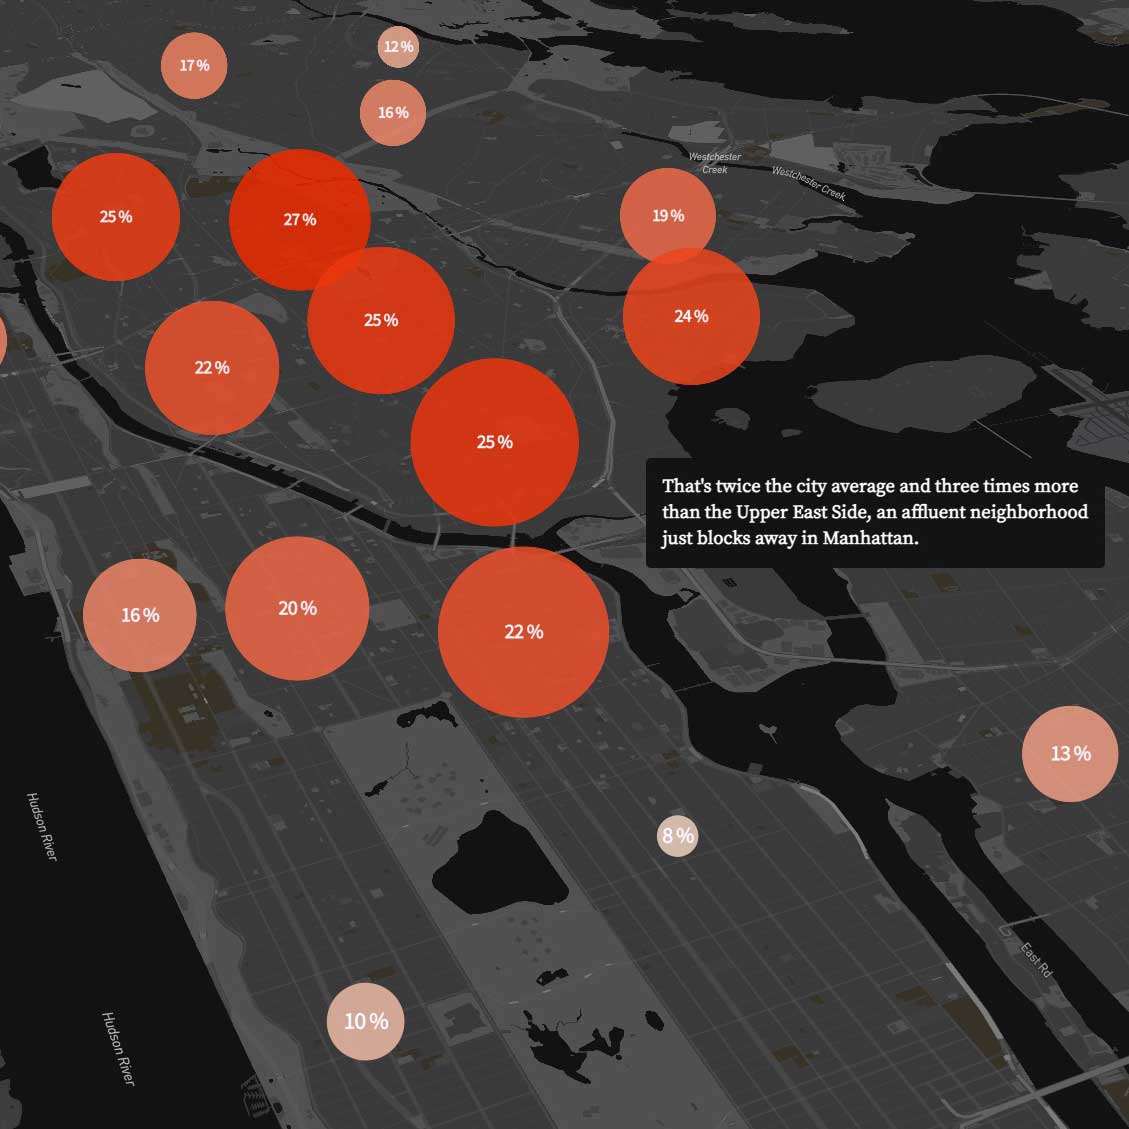
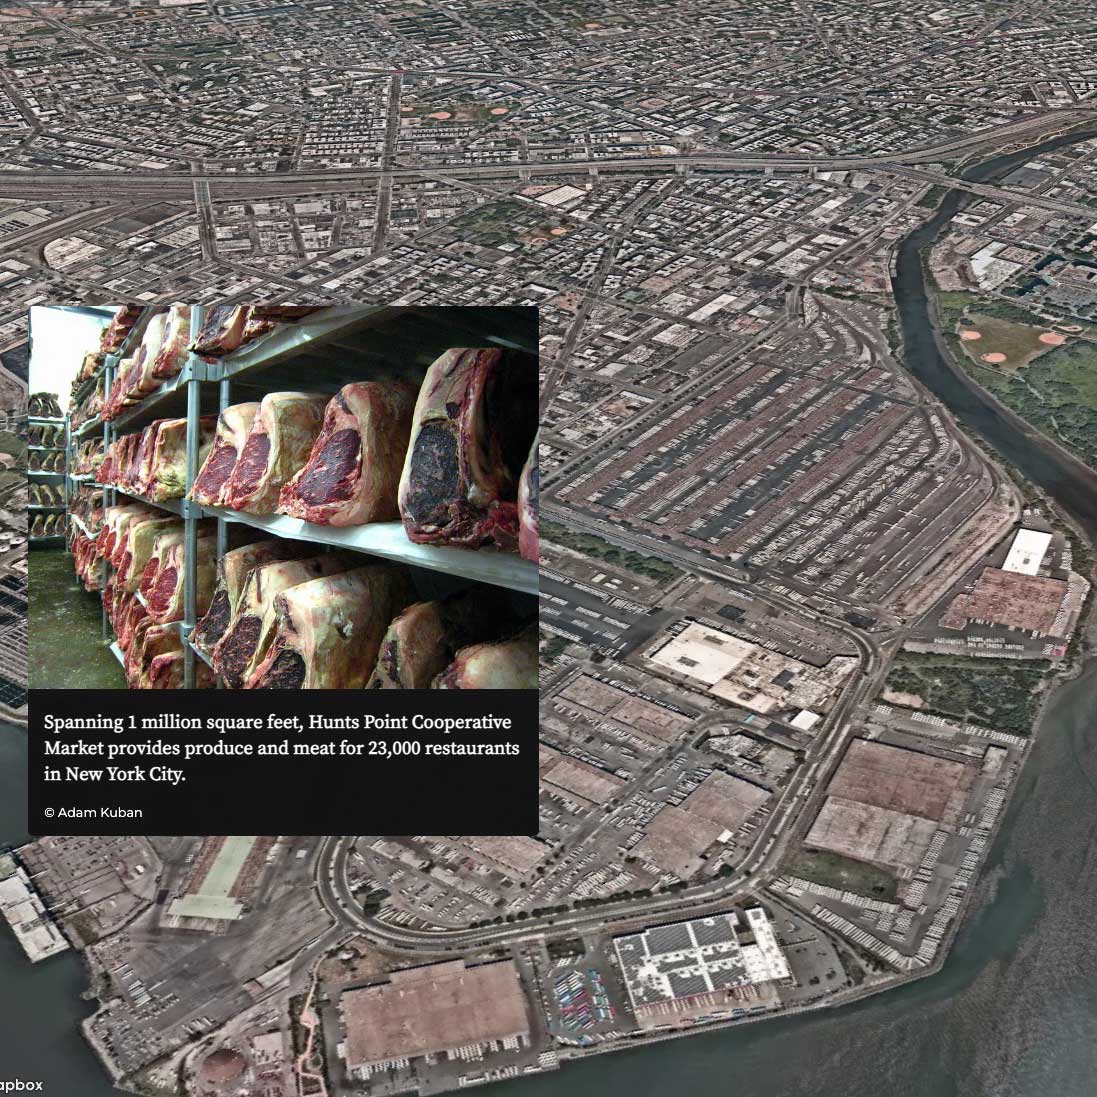
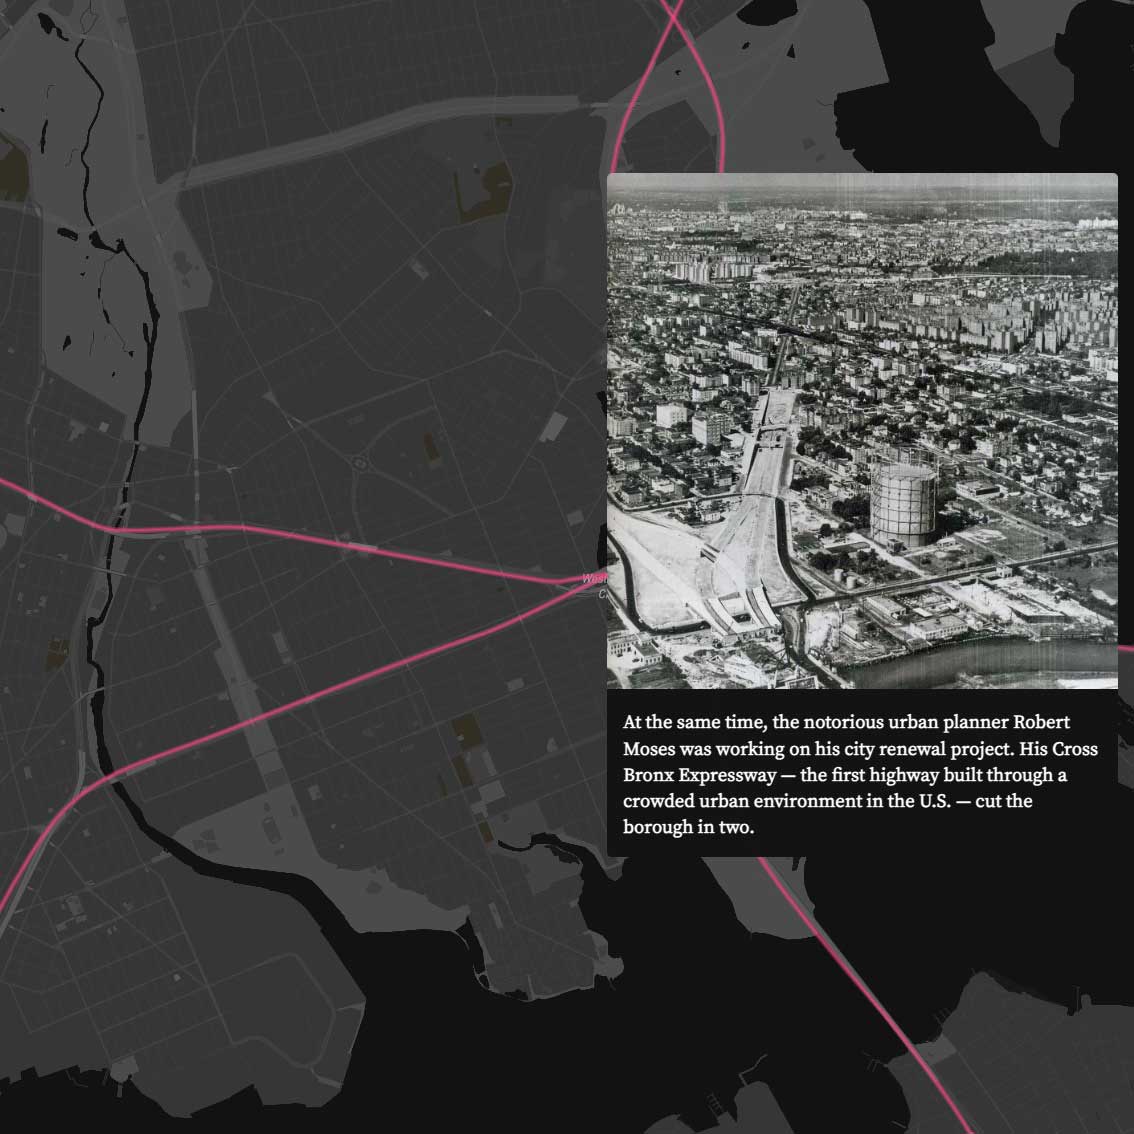
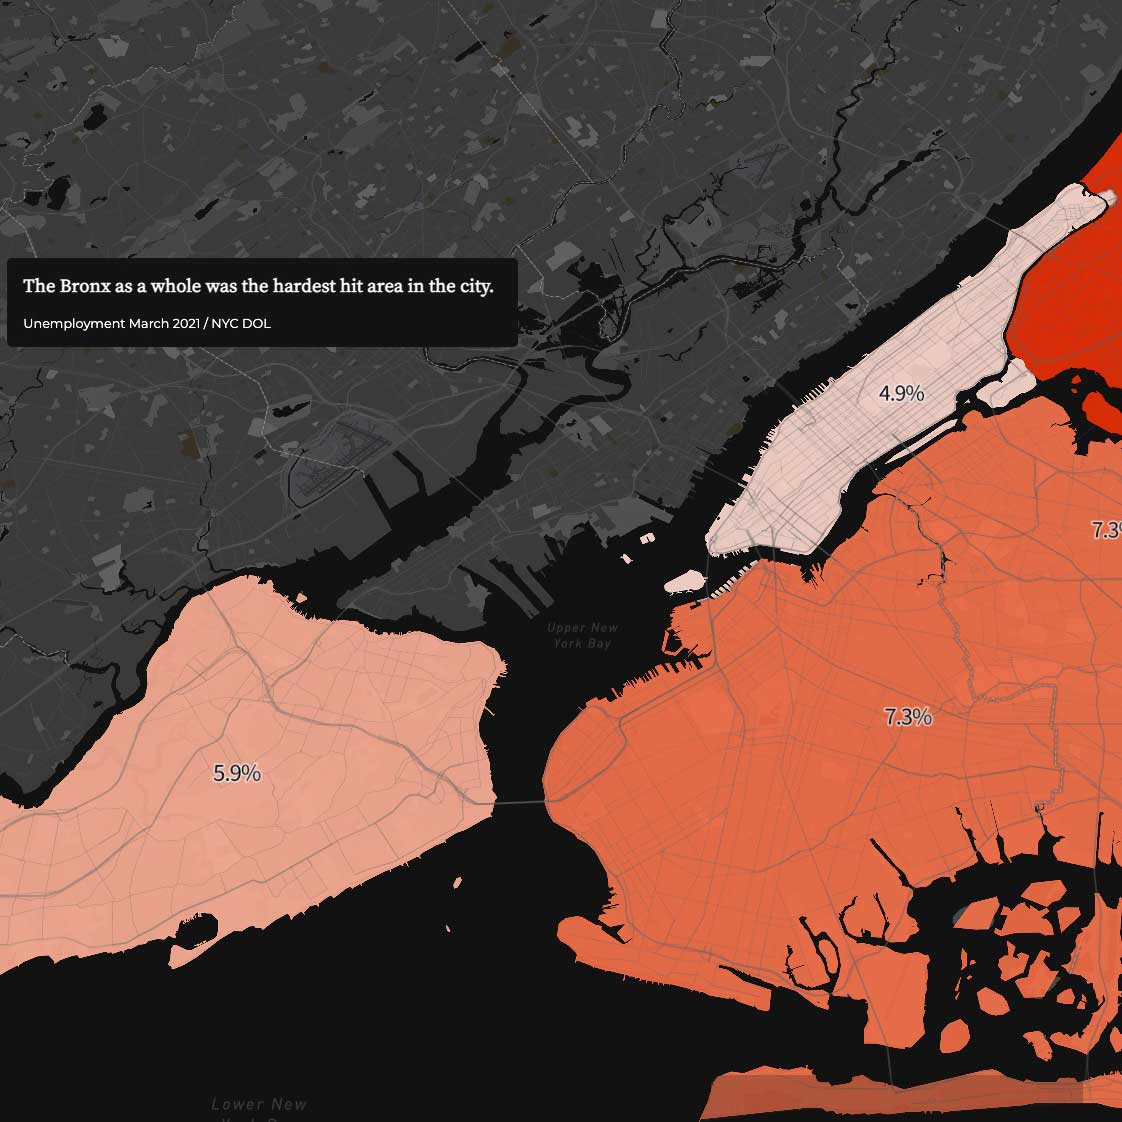
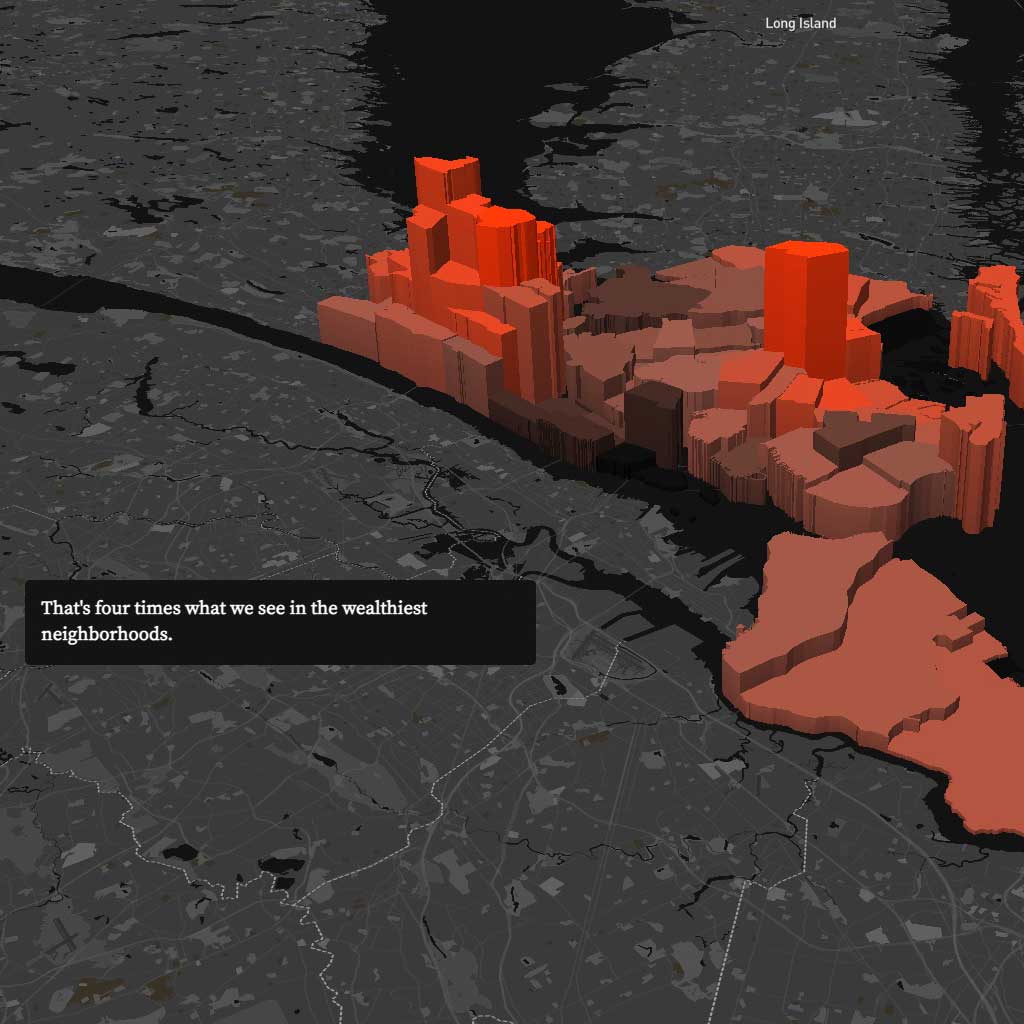
I built this responsive scrollytelling map to contextual local issues. Combining on-the-ground reporting, charts, and heatmaps, this complicated story is told with a simple downward swipe.
Mapbox, QGIS, Mapshaper, IntersectionObserver
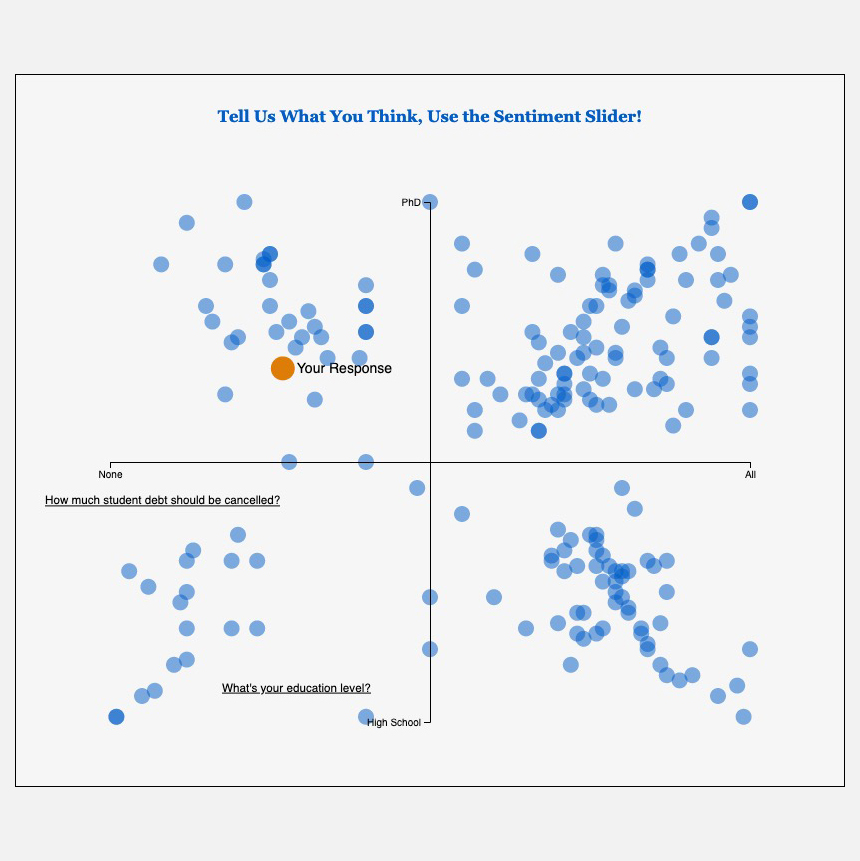
Boston Globe: Sentiment Slider0
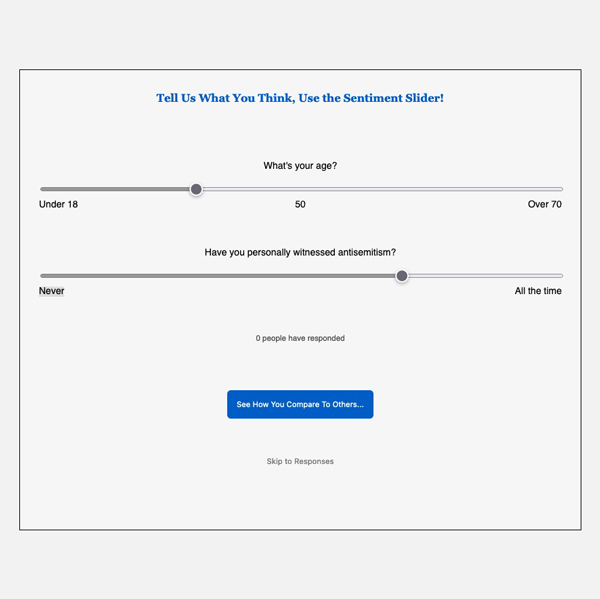
For the Boston Globe I built, tested, and deployed a unique feedback mechanism to gauge reader's reactions. The use of a cartesian grid and multiple linear responses put responses in useful context.
Gatsby, Firebase, D3, Airtable